Spreadsheet Sorcery: Making a map with SheetseeJS & Google Spreadsheets
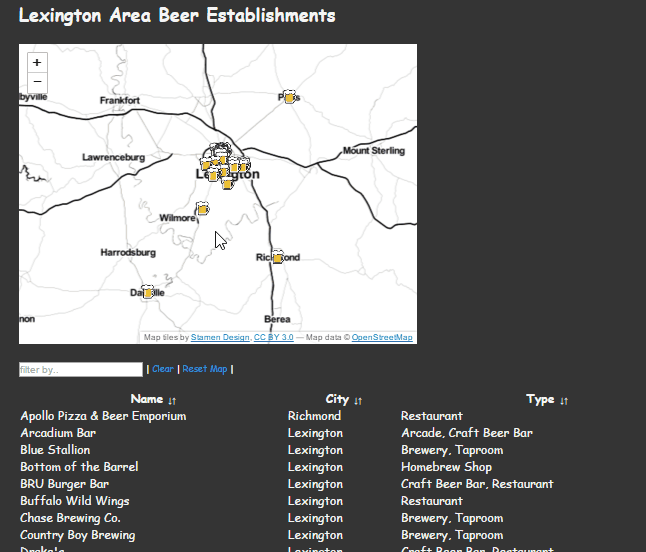
For the November 2015 meetup we learned how to make map pulling feature data from a Google Spreadsheet. This page is meant to help you walk through the process of making a map of Lexington-area beer establishments as compiled in this list by LexBeerScene.com
What we'll make
What we'll be using
Backend
- Google Spreadsheets
- LexBeerScene Spreadsheet
- Geocoder for Google Spreadsheets - We don't go into detail about this yet, but check out the linked post from Digital-Geography.com on how to geocode addresses within your Google Spreadsheet
Frontend
- mapboxJS/LeafletJS - Setting up map and map interaction
- SheetseeJS - Pulling data from Google Spreadsheets, transforming data to GeoJSON, data driven templates
- TabletopJS - Pull the data from the Google Spreadsheet
- HandlebarsJS - Templates for our table and info pane
- ICanHazJS - Mediates moving the data pulled from Google Spreadsheets into a Handlebars template
- jQuery - Interaction
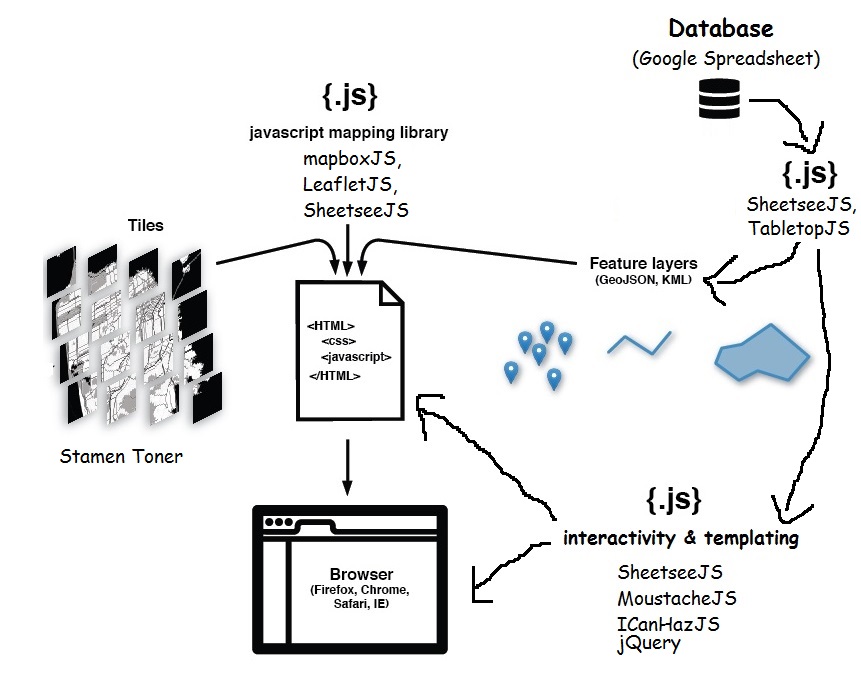 Adapted from "Anatomy of Webmap"
Setting up
Download project files
- Either clone the project spreadsheet-sorcery repo or download it as a ZIP. If you do the latter, you'll need to unzip the project file.
Start up a local server
- If you don't have it, download Python 2.7.x
- Open up Command Prompt (Windows) or Terminal (OSX, Linux)
- Navigate to the directory where you saved the project files
- Start local server:
python -m SimpleHTTPServer
- In your browser, navigate to:
localhost:8000
You'll use this to navigate around the various stages of the project we're working with.
Note: We recommend using the versions of the various JavaScript libraries included in the project repo. We've had some trouble getting everything to work with the most up-to-date versions of these libaries.